What Two Hours of AIS Data Reveal About the Bodrum–Kos–Rhodes Sea Corridor
Pilot Study · Version 1.0 · June 2026
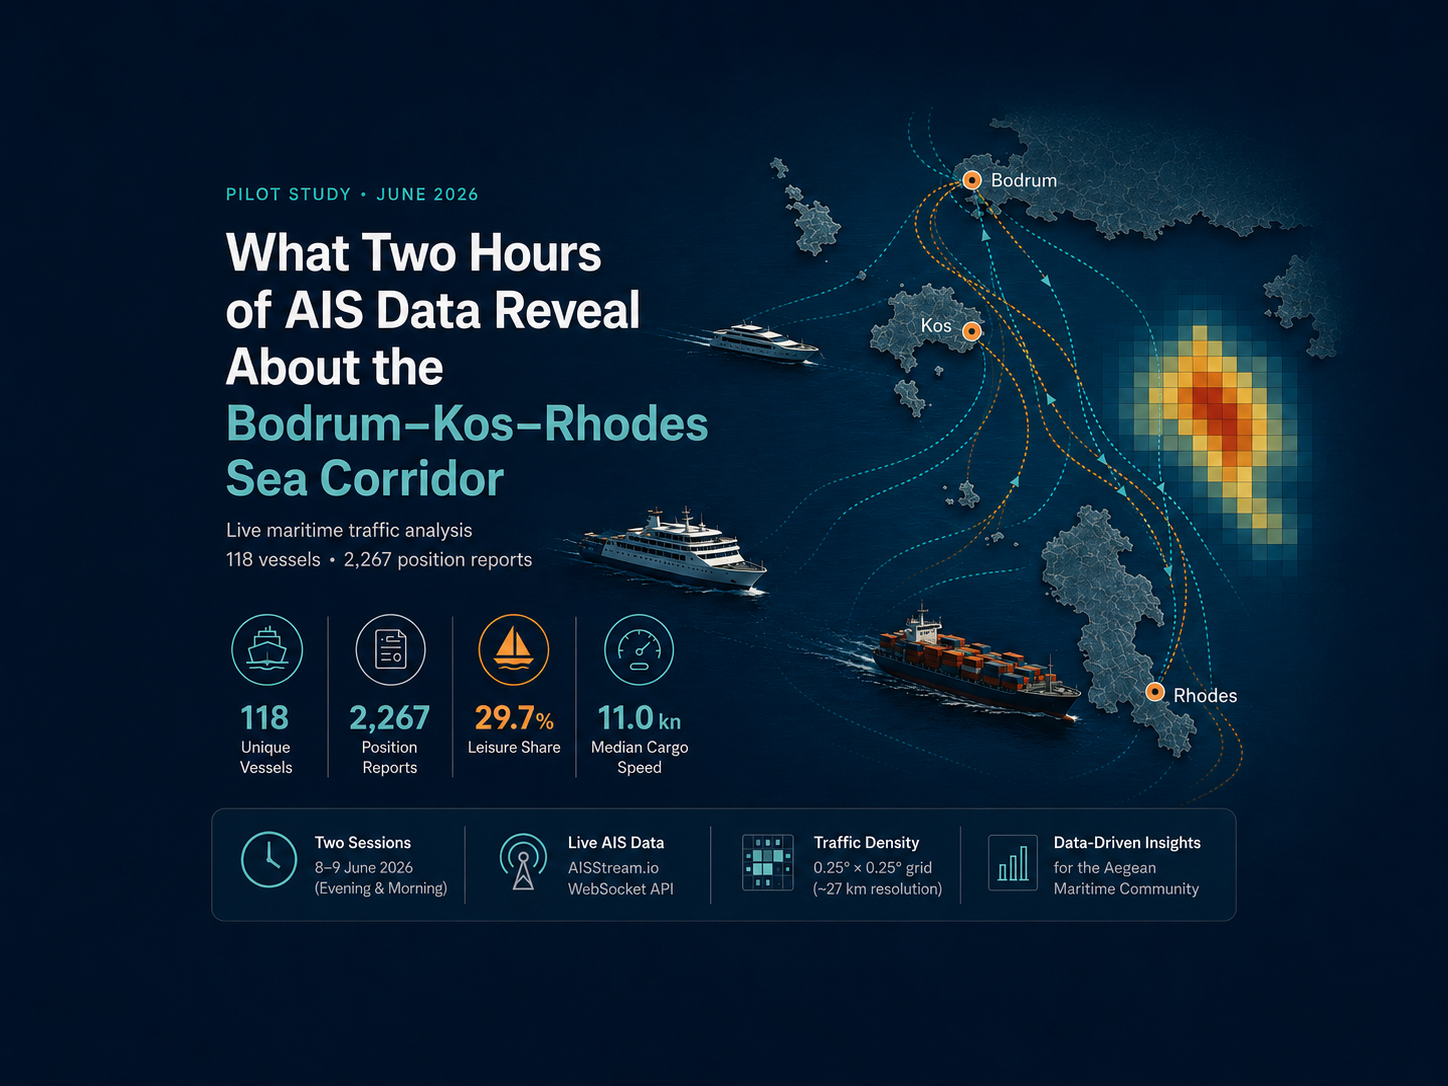
A pilot maritime traffic analysis based on 118 vessels and 2,267 AIS position reports collected in early June 2026
The Aegean Sea is often described through its coastlines, islands and tourism economy. But beneath the surface lies a constantly moving network of passenger ferries, cargo vessels, tankers, sailing yachts and pleasure craft.
To take an initial data-driven look at this activity, The Aegean Report conducted a pilot AIS traffic analysis of the Bodrum–Kos–Rhodes sea corridor. Using live vessel broadcasts collected on 8–9 June 2026, the study examined how different types of vessels move through one of the most active maritime areas connecting the Turkish coast with the Dodecanese islands.
The objective was not to make broad claims about the entire Aegean Sea. Two short observation windows cannot capture a full season, a typical week or even a complete day. Instead, this pilot study offers a transparent first snapshot and establishes the technical foundation for a longer-term maritime intelligence series.
The Study Area
The analysis focuses on the open-sea corridor between Bodrum, Kos and Rhodes, covering the area between 36–38°N latitude and 26.5–29°E longitude.
The collected AIS feed provided usable observations around:
The Bodrum peninsula and its outer anchorages
Kos and Rhodes port approaches
The Marmaris bay entrance
Open-sea lanes connecting the Turkish coast with the Dodecanese islands
Observed coverage in the collected feed was concentrated around the Greek island arc. During the collection windows, no usable observations were received for İzmir, Çeşme, Kuşadası or Çanakkale. The findings should therefore be interpreted as a corridor-level analysis rather than a study of the entire Turkish Aegean coast.
How the Data Were Collected
AIS, or Automatic Identification System, is a radio-based maritime tracking system used by vessels to broadcast information such as position, speed, identity and vessel type.
For this pilot study, live AIS messages were collected through the AISStream.io WebSocket API during two sessions:
Session | Date and Time | Raw Messages | Purpose |
|---|---|---|---|
Evening | 8 June 2026, 22:55–23:55 UTC+3 | 12,059 | Baseline view of cargo and leisure traffic |
Morning | 9 June 2026, 10:31–11:27 UTC+3 | 11,381 | Comparison of ferry and leisure activity |
After geographic filtering, coordinate validation and quality checks, the final dataset contained:
Metric | Result |
|---|---|
Unique vessels | 118 |
Clean AIS position reports | 2,267 |
Leisure vessel share | 29.7% |
Median cargo vessel speed | 11.0 knots |
The data pipeline was developed in Python. Live messages were collected through an asynchronous WebSocket client, stored in SQLite and processed through a reusable cleaning and analysis workflow. An interactive Streamlit dashboard was also built to explore vessel categories, speed ranges and traffic density.
Pleasure Craft Represent the Largest Vessel Category
Pleasure craft were the most common vessel category in the filtered corridor dataset, with 28 unique vessels and 498 position reports.
Cargo vessels and passenger vessels were also strongly represented, reflecting the mixed character of the corridor. This is not simply a leisure route. It is a shared maritime space where tourism activity, regional ferry services and commercial shipping intersect.
Vessel Category | Unique Vessels | Position Reports | Median Speed |
|---|---|---|---|
Pleasure Craft | 28 | 498 | 10.3 kn |
Cargo | 22 | 468 | 11.0 kn |
Passenger | 21 | 570 | 15.0 kn |
Tanker | 8 | 164 | 10.5 kn |
Sailing Yacht | 7 | 127 | 8.7 kn |
Pleasure craft and sailing yachts together account for 29.7% of all observed vessels. When vessels without an identified type are excluded, leisure vessels represent 37.6% of the classified dataset.
This is already a visible early-summer signal. The same analysis will become more meaningful when repeated during the August peak season.
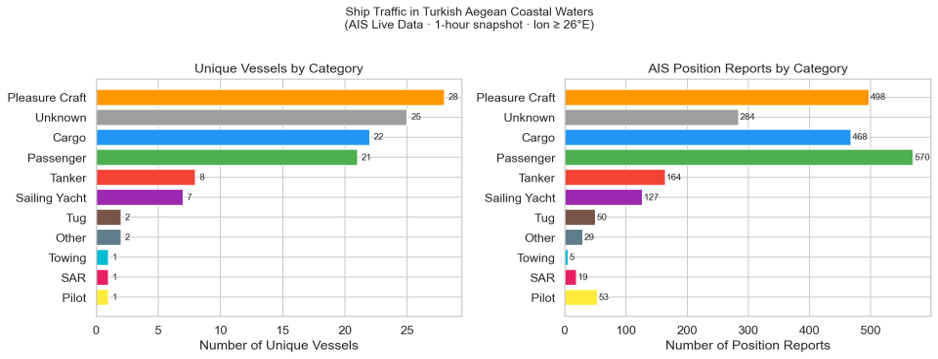
Figure 1 — Vessel distribution by category, measured by unique vessel count and AIS position reports.
Passenger Vessels Are the Fastest Category
Passenger vessels recorded the highest median speed in the dataset at 15.0 knots. Their speed range was also wider than that of cargo vessels and tankers, which is consistent with a mix of conventional ferry services and faster passenger operations.
Cargo vessels moved at a median speed of 11.0 knots, while tanker speeds were more tightly clustered around 10.5 knots.
Category | Median Speed | Q25 | Q75 | Maximum |
|---|---|---|---|---|
Passenger | 15.0 kn | 10.2 kn | 17.2 kn | 27.9 kn |
Cargo | 11.0 kn | 8.7 kn | 12.0 kn | 14.9 kn |
Tanker | 10.5 kn | 10.2 kn | 11.5 kn | 12.0 kn |
Pleasure Craft | 10.3 kn | 7.6 kn | 10.7 kn | 18.9 kn |
Sailing Yacht | 8.7 kn | 8.3 kn | 9.0 kn | 9.5 kn |
Median values were used instead of averages because vessel-speed distributions are not symmetrical. Anchored vessels, slow port approaches and a small number of high-speed transits can distort the mean. The median provides a more representative measure of typical movement.
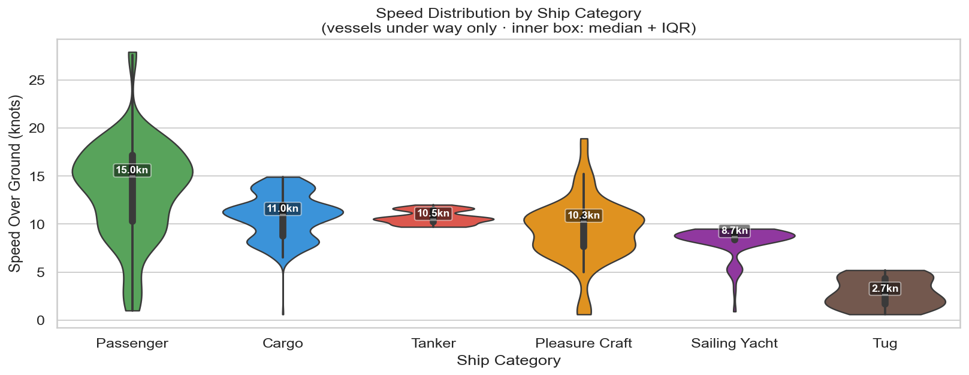
Figure 2 — Speed distributions by vessel category for vessels under way, using a speed-over-ground threshold above 0.5 knots.
Morning and Evening Traffic Show Different Patterns
The two observation windows offer an initial indication that traffic composition changes throughout the day.
Passenger vessel activity increased from 13 vessels in the evening session to 15 vessels in the morning session. This modest rise is consistent with scheduled morning movements on regional routes such as Bodrum–Kos and Marmaris–Rhodes, although the two-session sample is not sufficient to confirm a direct causal relationship.
Cargo traffic remained stable at 12 vessels in both sessions.
Category | Evening Session | Morning Session | Change |
|---|---|---|---|
Passenger | 13 | 15 | +15% |
Cargo | 12 | 12 | No change |
Pleasure Craft | 25 | 21 | −16% |
Sailing Yacht | 4 | 6 | +50% |
Sailing-yacht activity increased from four vessels to six during the morning session, potentially reflecting departures from nearby anchorages. Pleasure-craft activity declined slightly in the morning snapshot.
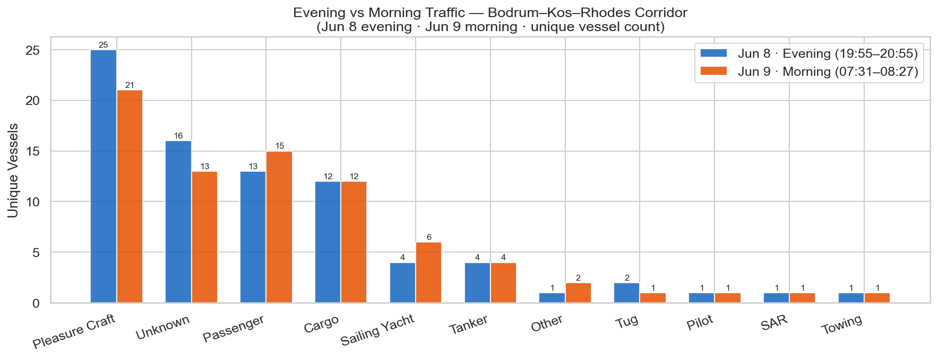
Figure 3 — Unique vessel counts by category during the evening and morning collection sessions.
Mapping Traffic Density
A grid-based density analysis was used to identify areas where vessel activity was most concentrated. Each cell represents a 0.25° × 0.25° area, corresponding to approximately 27 kilometres.
The resulting heatmap highlights the uneven distribution of maritime traffic across the corridor. Some areas function as open-sea transit lanes, while others reflect port approaches or anchorage-related activity.
This first density map is deliberately simple. Future versions of the analysis will incorporate coastline overlays, labelled reference points and reconstructed vessel trajectories.
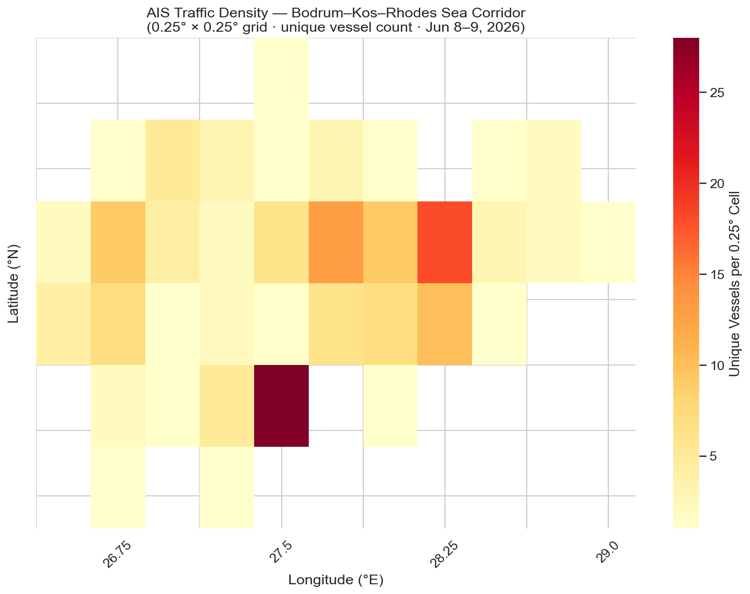
Figure 4 — AIS traffic density across the Bodrum–Kos–Rhodes sea corridor, measured by unique vessel count per grid cell.
Limitations & Methodological Notes
• Single early-summer snapshot: Two one-hour sessions in June cannot capture seasonal, weekly, or daily traffic patterns. August peak-season data will be collected for comparison.
• AIS coverage gaps: İzmir, Çeşme, Kuşadası, and Çanakkale have no AISStream.io terrestrial receiver coverage. Findings cannot be generalized to the northern Turkish Aegean coast.
• Unknown vessel type (21%): Vessels without received ShipStaticData are classified as Unknown. In a longer collection window, most would be identified as static messages accumulate.
• AIS non-participation: Small recreational craft under 300 GT are not required to carry AIS. Actual leisure traffic density is likely higher than reported.
• Position accuracy: AIS messages include a position accuracy flag (0 = >10 m, 1 = <10 m GNSS). Positional error is not analyzed in this study.
Future Work
This study will be replicated in August 2026 to enable a seasonal comparison between early summer (June) and peak summer (August) traffic patterns. The same pipeline (collector.py → cleaner.py → analysis.py) will be reused; new sessions will automatically merge into the existing SQLite database.
Planned extensions:
• August 2026 replication — peak season comparison
• Multi-day collection — capture weekly patterns (weekday vs weekend)
• AIS Class B filter — isolate leisure craft sub-analysis
• Route reconstruction — connect sequential positions per MMSI to visualize vessel trajectories
Source Code
GitHub repository: github.com/sdnzthewitch/aegean-ais-analysis
Technology Stack
• Python 3.13 — websockets, pandas, sqlite3, matplotlib, seaborn, plotly, streamlit
• SQLite — lightweight embedded database; sessions accumulate without schema changes
• AISStream.io — real-time AIS WebSocket API (free tier)
• Streamlit Community Cloud — free dashboard hosting
• GitHub — version control; .env excluded via .gitignore
Data source: AISStream.io real-time AIS WebSocket API. AIS data is publicly broadcast by vessels under IMO SOLAS regulations Chapter V. Collection date: 8–9 June 2026.
Comments
No comments yet. Be the first.